Practical Approach for Elements within Incorporated Charged Zinc Particles in an Anode Zinc Reactor of a Fabricated Zinc Bromine Battery Cell System (ZnBr2) with Fitting Materials - Juniper Publishers
Trends in Technical & Scientific
Research
Abstract
Batteries with different chemistries and designs encounters various (redox reactions) to store energy through applying charges and discharges rates. Redox flow batteries systems such as zinc bromine batteries cells systems (ZnBr2) can be enclosed with high surface area anode electrodes (reactors) and charged with some amount of added carbon particles for zinc deposition. The electrochemical reactions within a fabricated ZnBr2 battery cell system have been investigated with the coupled inlets and outlet brass fitting materials (15mm and 30mm) of different anode and cathode electrolyte compositions. SEM analysis was explored on some charged particles collected from the anode reactor to identify all the existing elements within the deposited charged zinc particles after several charges. The investigated zinc particles were between 254 microns to 354 microns. The electrolyte composition includes 3 moles of KBr (535.51 grams), 1 mole of KCl (111.89 grams) as the cathode side electrolyte and 3 moles of ZnBr2 (675 grams), 1 mole of ZnCl2 (205 grams), and 1M of KCl (111.826 grams) as the anode electrolyte solution. Originally, this journal paper has discovered the importance of coupling chemically resistance materials to ZnBr2 cells as investigated on the fabricated ZnBr2 cell that was initially converted to a CuZn2 battery cell system and reverted to the ideal ZnBr2 cell system before using an SEM technique to identify separately the present elements.
Keywords: SEM Analysis on Elements; Flow Rate; Reverting Battery Cell System
Introduction
As previously presented in a journal titled (Practical Development of a ZnBr2 Flow Battery with a Fluidized Bed Anode Zinc-Electrode), Journal of the Electrochemical Society, Volume 167, Number 5, various categories of anode reactors designed in solidwork were numerically examined before choosing the best candidate reactor and later passed different coulombs of charges and discharges to the fabricated ZnBr2 battery cell after the incorporated chosen reactor to the cell anode side and later explored the presented SEM analysis carried out in this paper on some particles collected from the anode reactor [1].
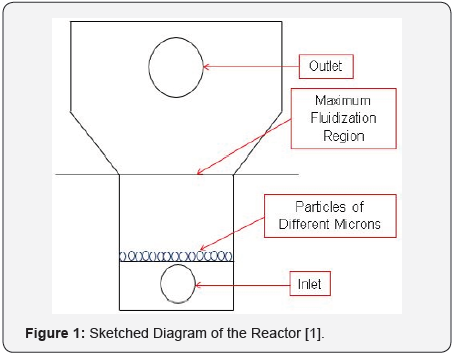
The fluent version in Ansys has assisted to successfully modelled a fluidized bed to address problems facing zinc-bromine battery cells systems. Such as dendrites problems within the cell; puncturing membranes of these cells systems and thereby resulting to cut off voltages, short circuits that also reduces their life span. Introducing and modelling a fluidized bed zinc electrode has demonstrated fast deposition of zinc ions within the battery system zinc electrode and serve as an incorporated alternative electrode to prevent depositing zinc ions onto a solid electrode previously making ZnBr2 cells to encounter mechanical abrasion and deteriorating the electrodes as zinc ions stays longer on them than the expected time [1-3]. See the presented schematic diagram in Figure 1.
Introduction to SEM and Fluidized Bed Reactors
SEM (scanning electrons microscopy) and fluidized bed zinc anode reactors has several benefits. Some of these benefits include using SEM to examine electrode sample homogeneity and fluidized bed reactors for multiphase mixing purposes etc. Elements present within injected particles to zinc bromine batteries cells systems; anode zinc electrode can be examined using SEM analysis. Redox flow batteries cells systems (RFB’s) such as zinc bromine batteries cells systems enclosed with high surface area zinc electrodes are capable to prevent the issue of dendrite formation within these batteries cells systems.
By means of SEM, scanning of electrons microscopy, samples images sample can be produced through focusing on the beam of electrons [4]. Anode zinc reactors of ZnBr2 batteries cells systems are usually in liquid and solid phases. Both the two phases, liquid and solid are common in petrochemical industries, biological industries in chemical industries and particularity for adsorption, cracking (catalytic), crystallization and for ion exchange [5] etc. Particles sizes and shapes within anode reactors has huge impact to achieve fluidization and prevent dendrite formation in ZnBr2 cells. However, majority of these fluidized beds are not always designed properly before fabrication and to tailoring them to the mean particle size; especially for those in use for particle size distributions [6-18].
Particles behaviour are now usually modelled using the DEM technique, (discrete element method). DEM approaches are used to represent particles numerically and individually by identifying them with their specific properties (shapes, magnitude, properties of their material and the original velocity) [19-21]. The geometry interior shape accommodating all the injected particles are the domain for the simulation. Designed reactors can be separated by grids to identify the positions of particles prior to modelling and simulating.
Based on Newton’s laws, injected particles in reactors are subjected to have good contacts and can be exposed to a small motion during the iteration process [22-24]. Contacts among injected particles in a ZnBr2 anode reactor can be monitored throughout discrete reactions, modelling stages and to determine the particles contact forces ad magnitude through a spring dashpot model. The acceleration of drag forces on fluid and particles, total forces and summation can be computationally balanced before determining individually the parameters and particles motion [25].
Particles properties, such as structure can differently be observed using SEM, scanning of electrons microscopy and their sample compositions, and any interacted atoms within the provided sample [26,27]. In most application, over the surface of samples, data collections are possible within the selected area and spatially displayed variances in their properties. Areas in between 1 cm to 5 microns can be imaged using such technique and within a spatial resolution of 50 to 100nm through using conventional scanning electrons microscopy method [28-31].
Suitable qualitative approaches, semi-quantitative, structural crystal or using EBSD to observe the orientation of the crystal and selecting point on samples are possible on SEM to determine chemically various compositions by means of an energy dispersive x-ray spectroscopy (EDS) [29,32]. Typically, scanning electron microscopy, as probes electrons micro-analyzer, EPMA, has considerably several existing designed functions of overlapped capabilities among other analytical instruments.
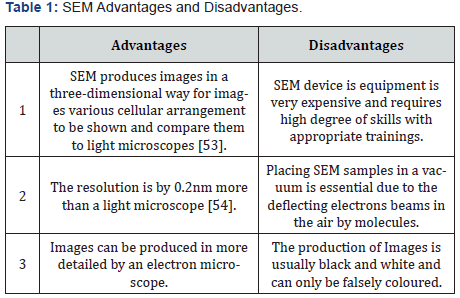
Backscattered electrons can be standardly collected using an SEM and electrons sources are the basic part of SEM. Through SEM analysis, electron’s properties, electrodes dispersion and their homogeneity can also be observed [33,34]. The sources of electrons, high voltages encountered across them, electrons accelerating toward the samples, electromagnetic lenses, temperatures, detectors, and data systems collections are diffractions of samples usually at high incidence angles [35-40]. Within a user interface, SEM does not rely on a 2θ angle, rather to act marginally and similarly to a light microscope [41]. Some SEMs are equipped to count samples, detect, and analyze off a scattered x-ray. Through such type of detectors, the elemental composition of a sample can possibly be determined [42-44]. Table 1 has further presented other advantages and disadvantages of scanning electrons microscopy, SEM.
Materials and Suppliers
Materials and Method
SEM Preparation
By exploring scanning of electrons microscopy (SEM) on some of the collected charged particles from the anode zinc reactor was to discover all the enclosed various elements after charging and discharging the zinc bromine battery cell at different charge rates. Before exploring SEM analyses on the charged deposited zinc morphology collected from the anode reactor were dried in an oven at a temperature of 50°C to prevent these particles from agglomerating together.
The investigated particles sizes were in between (254 microns to 354 microns). Some of these particles from the anode-side zinc electrode after charging the cell were viewed at different microns (100 microns, 50 microns, 10 microns and 5 microns) by using the JEOL JSM-6010 PLUS/LA (SEM) scanning electron microscope machine.
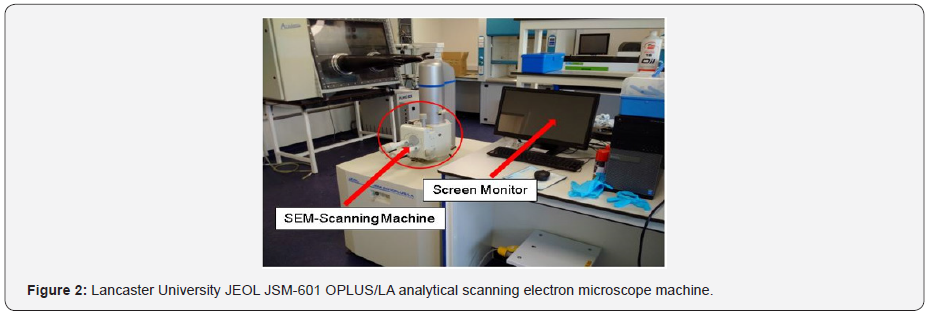
The SEM characterization of the zinc electrodeposits were examined after charging the cell at a charge rate of 0.27 amps and 0.3 amps. The anode-electrolyte composition includes 3 moles of ZnBr2 (675 grams) Solution, 1 mole of ZnCl2 (205 grams), and 1 mole of KCl (111.826 grams). The cathode electrolyte solution includes 3 moles of KBr (535 grams) and 1 mole of KCl (111.897 grams). The anode electrolyte solution density was 1.47g cm-3 which was used to gauge the cathode-electrolyte. A flow rate of (166.7cm3/ min) was maintained throughout the experiment. The used JSM-6010LA/JSM-6010LV equipment for the scanning process was a compact mobile SEMs device with high performance and suitable for research use (Figure 2). The surface structures are observed by secondary electrons, the distribution of materials in a specimen was observed by backscattering the electrons and analysing the elements by EDS (energy dispersive X-ray analyser). All the necessary functions are available in the all-in-one mobile multi-touch-panel SEM [45-49].
Results Analysis and Discussion
Examined Particles
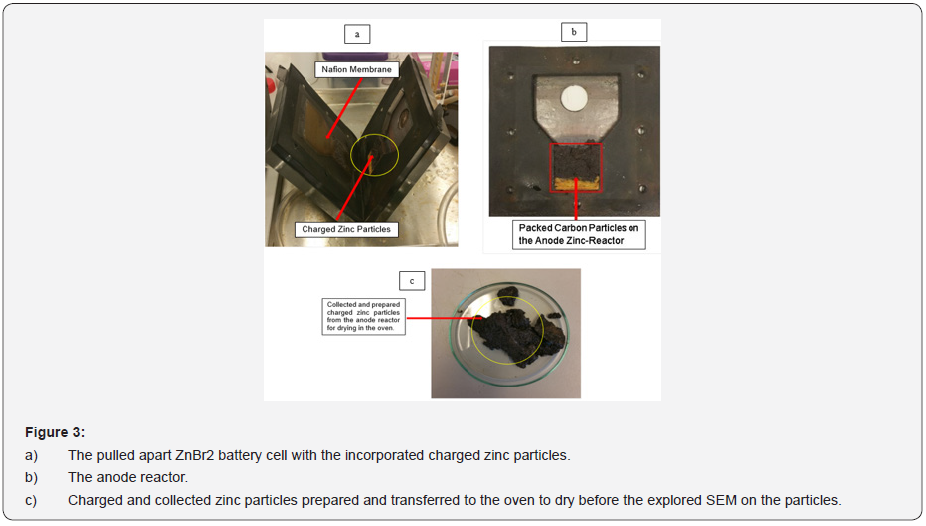
Particles collected from the anode zinc reactor in the lab for SEM analysis (scanning of electrons image) occupied some white edges after the charge and discharge experiments according to the colour mapping. (Figures 3a-3c) for the decoupled anode and cathode cell reactor, the anode zinc reactor incorporating charged zinc particles, the collected and prepared charged electrodeposited zinc morphology enclosed within the small glass coin beaker for SEM analysis. Encountered degasification, the removal of dissolved gases from the anode and cathode electrolyte solution was due to the solid and liquid interfaces enclosing some formed bubbles during the experimental work. The observed degasification was concluded to have originated from particles that were not properly dried before removing them from the oven and before the SEM process. Particles not properly dried before the SEM analysis were expected to have strangely behaved and changed the zinc morphology (shape and structure) due to the observed gasification.
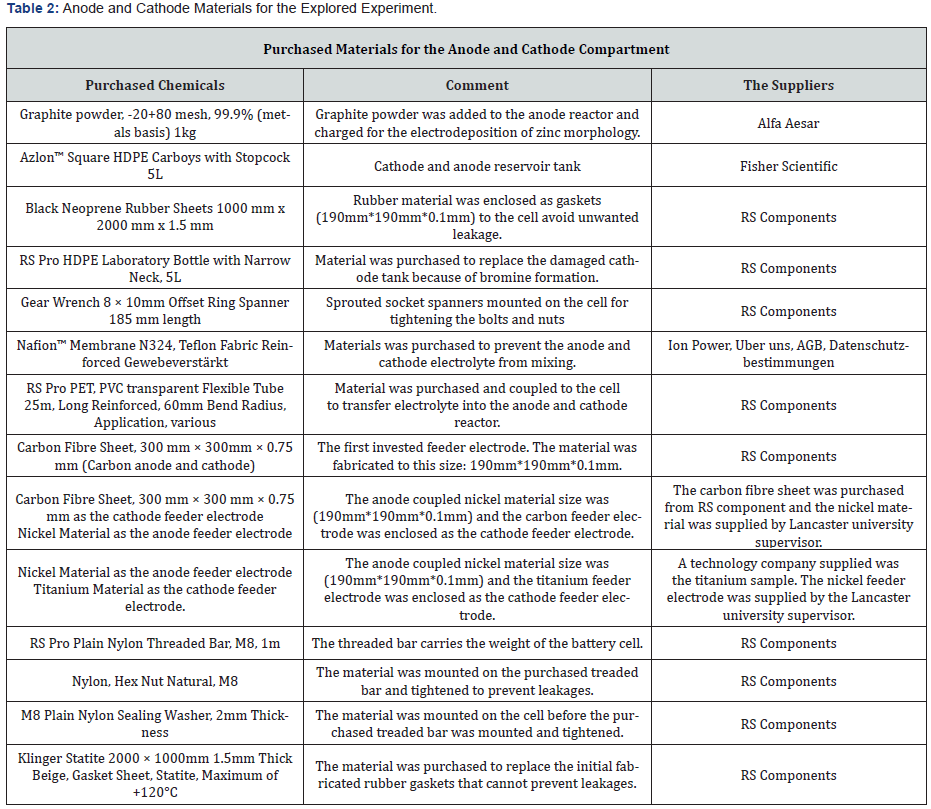
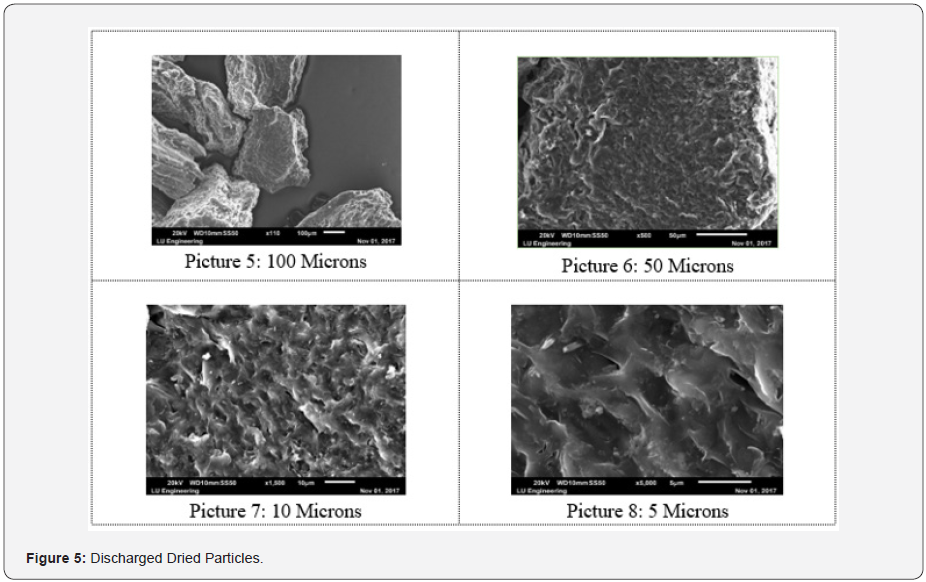
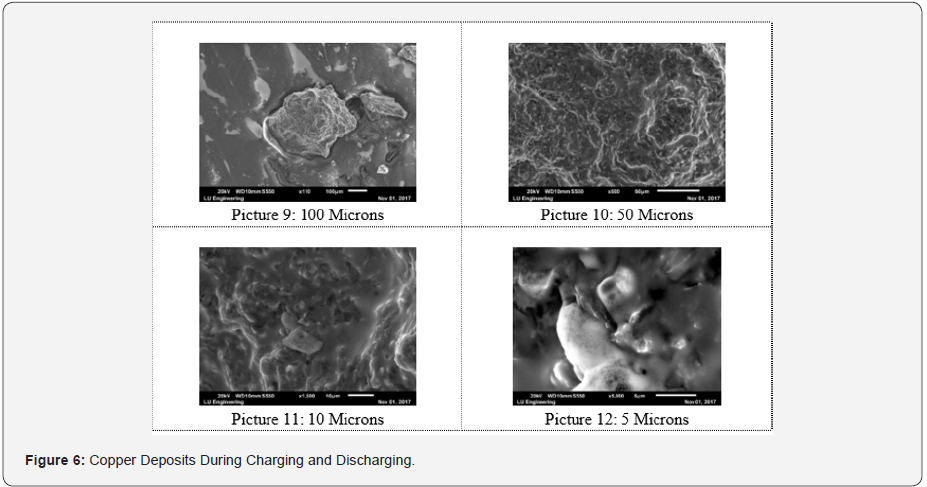
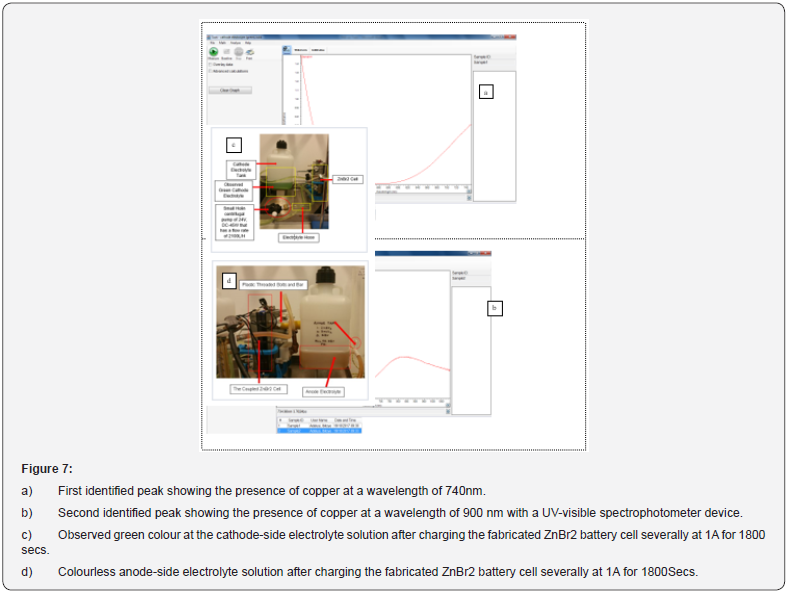
The dried and examined zinc morphologies presented in Figures 4-6 were studied using the scanning of electron microscopy, SEM characterization to observe elements enclosed within these particles after the redox reaction (charged and discharged) to store and discharge the stored energy by the fabricated zinc bromine battery cell and after observing copper deposits at the cathode-side electrolyte due to the brass fittings that were not chemically resistance that initially changed the battery to a copper-zinc RFB cell before it was reverted back to a zinc-bromine battery cell by changing some of the materials. See the two graphical peak plots in Figure 7a & 7b for the identified copper showing the presence of copper at a wavelength of 740nm and at a wavelength of 900nm with a UV-visible spectrophotometer device (Table 2).
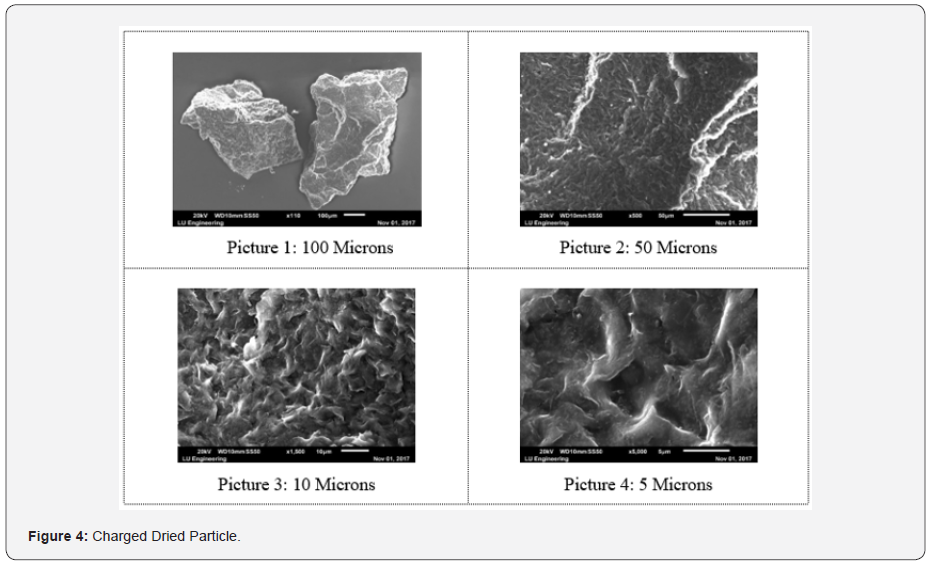
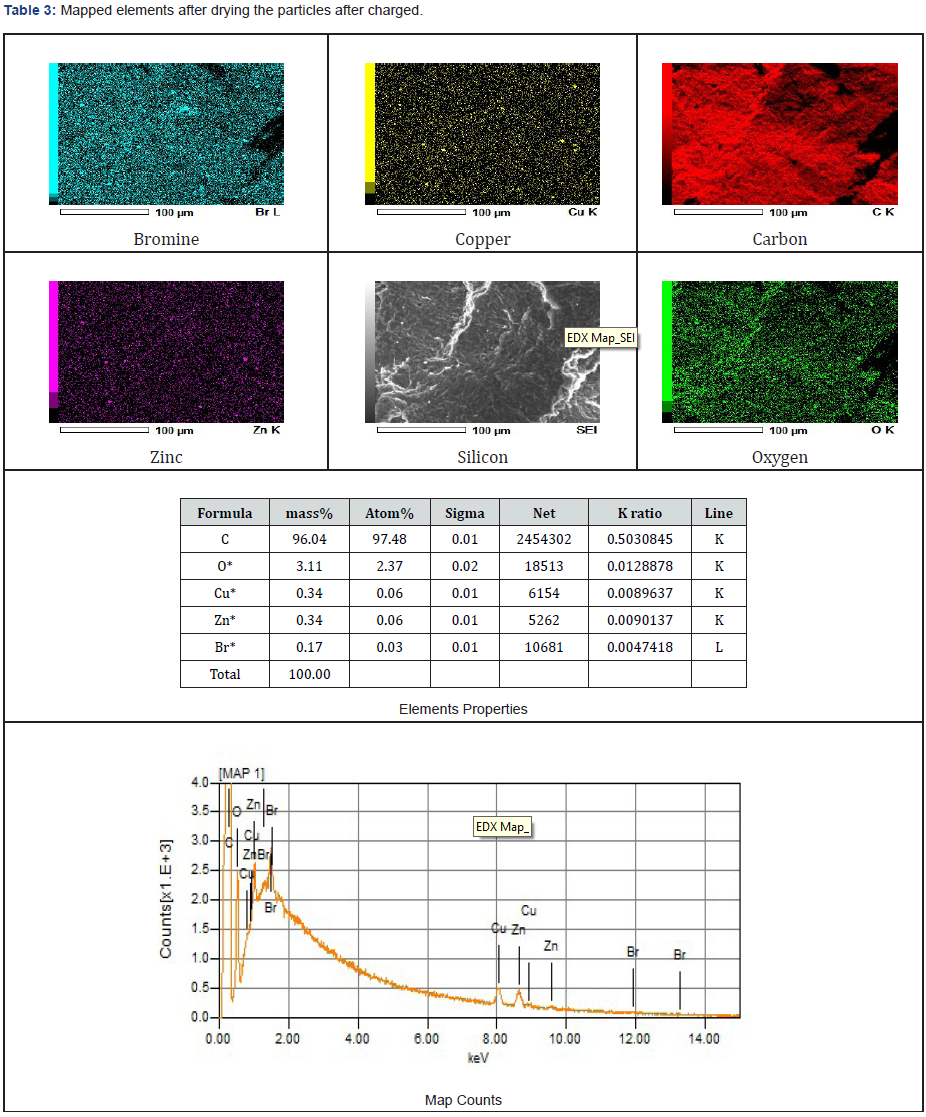
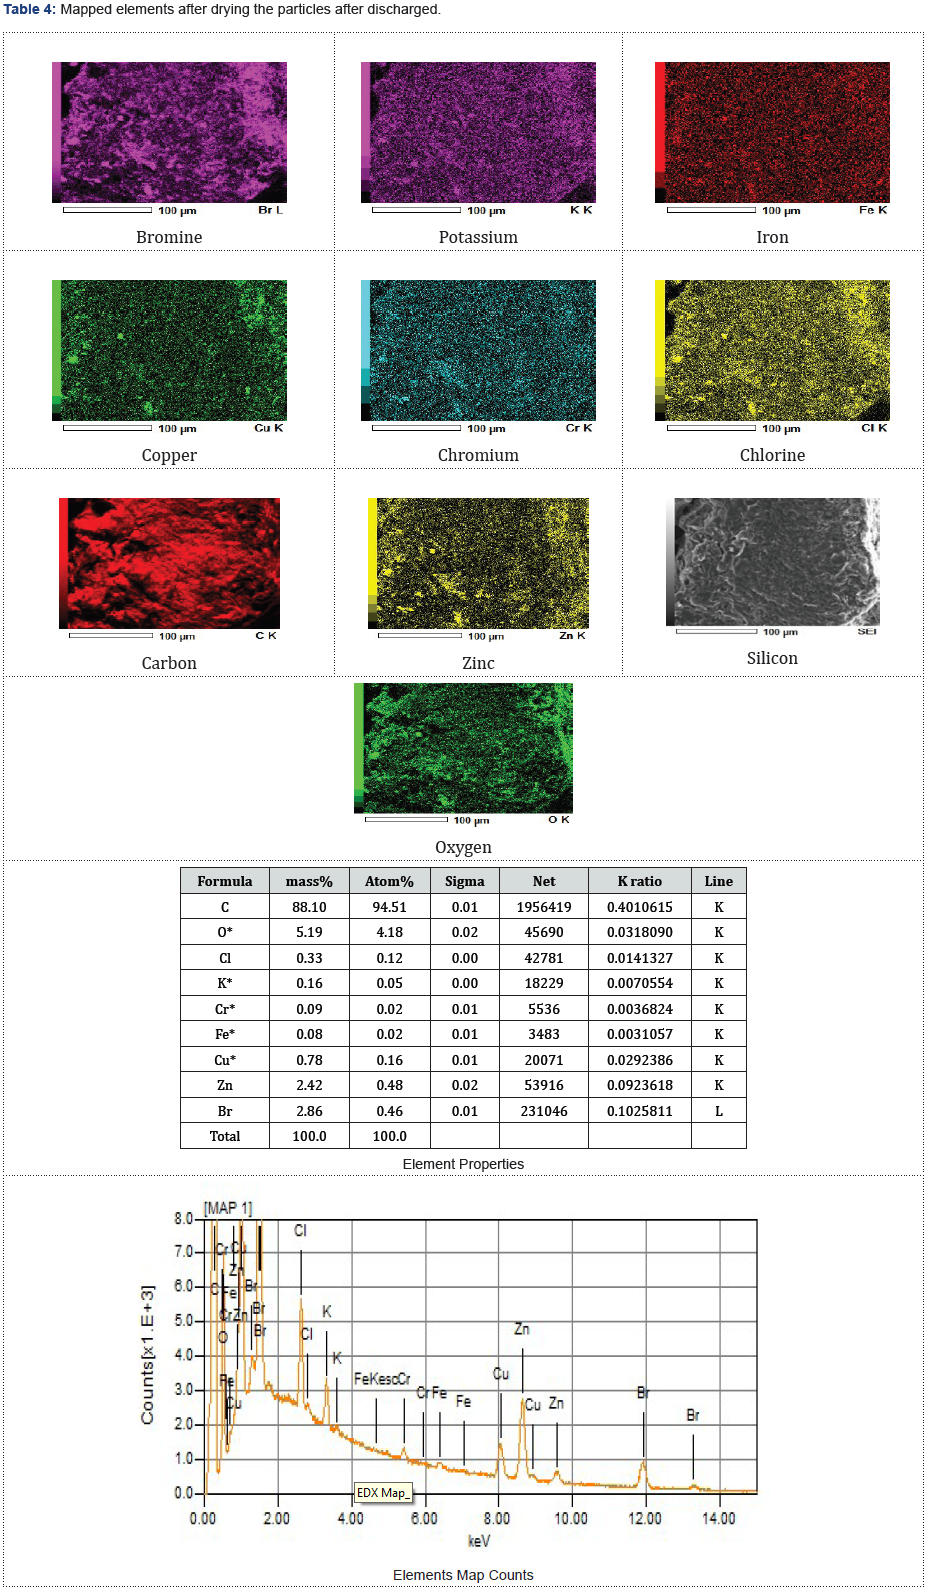
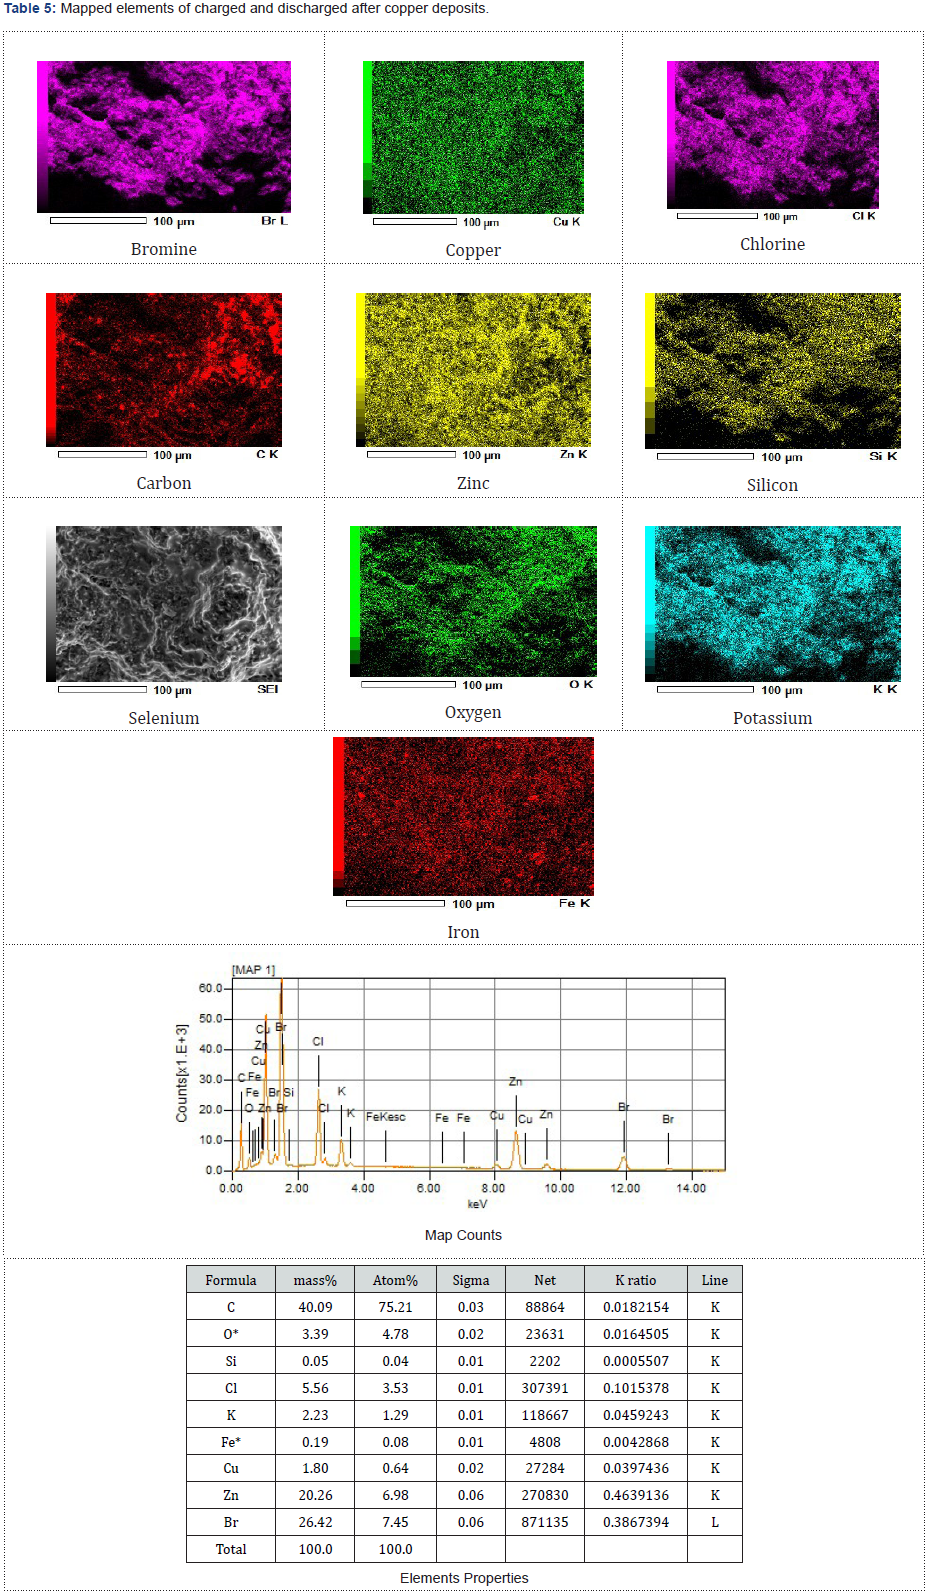
As presented in Tables 3-5, the images of the mapped elements during the SEI, scanning of electrons images showed no hydrogen traces subsequently after charging the ZnBr2 battery cell at various charged and discharged amperes.
Zinc deposited within the anode reactor via SEM were viewed using different microns. Picture 1, observed as 100 microns has a sedimentary rock shape, photo 3, viewed in 10 microns has high mossy deposits that look like zinc clusters. Picture 2 of 50 microns resemble silt sand that was sticky together, and photo 4, was observed in 5 microns. Particles collected after discharging the stored energy by the battery cell were like the charged particles examined via SEM. Furthermore, the carbon fibre feeder electrode materials also contributed to the low current in between (-300 mA to 300 mA) that was observed continuously when the fabricated battery cell was charged and throughout its mode of operation. In the past, a similar magnificently SEM results have been achieved despite using the appropriate working electrodes materials, primary and secondary supporting electrolyte which also enhanced a good electrochemical behaviour [50].
Charged and Dried Particles
Discharged and Dried Particles
Cu Electrodeposition at Charge and Discharge
UV-Visible Spectrometer Device and Peak Plots
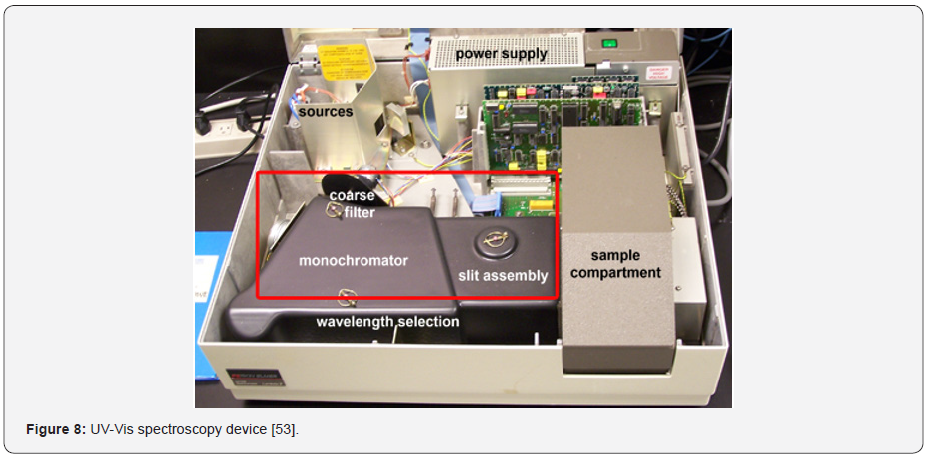
As presented in Figure 8, a UV-Vis spectroscopy laboratory device is a simple, quick, and not expensive measurable technique for measuring the amount of light absorbs by a chemical substance. See also Figure 7a-7c and Figure 9 for other results. The process can be carried out by gaging the light intensity passing through a sample in relation to the light intensity through a blank reference or sample. Multiple techniques can measure types of multiple samples, either in thin film, glass, liquids, or solids. UV-Vis Spectroscopy as a measuring device is suitable to know the transmitting, absorption and the functioning reflection of a material wavelength in the range of 190 nanometers to 1,100 manometers [51,52].
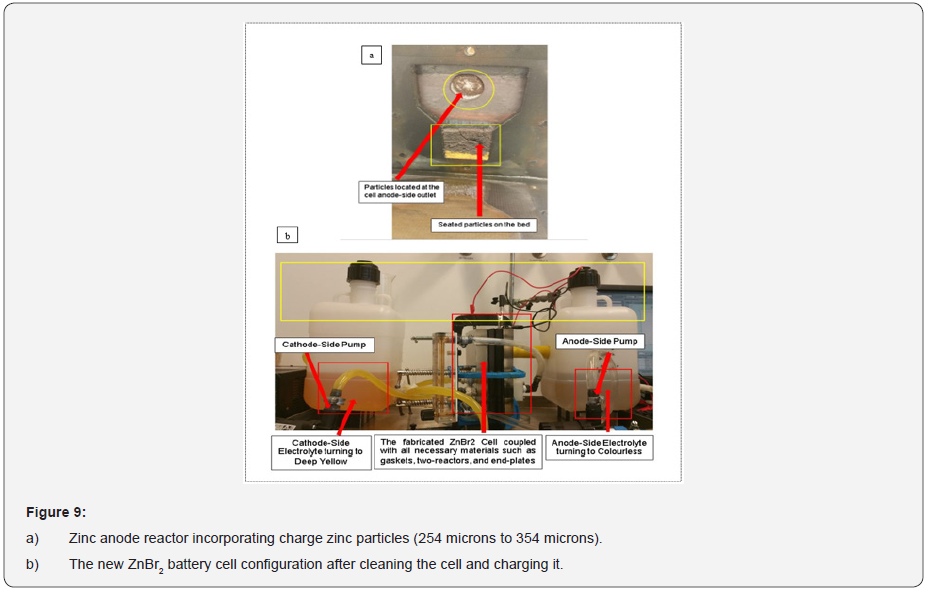
With a UV-Vis spectroscopy device, it was possible the observed brown deposits within the cathode electrolyte solution as copper by collecting some of this electrolyte solution in a small glass bottle after passing these charges to the cell: (1) 0.1 amps and -0.1 amps for 3600 secs and 800 secs (2) At 0.1 amps and -0.1 amps for 3500 secs and 200 secs and (3) At 0.25 amps for 3600 secs and -0.25 amps for 100 secs with 3 moles of KBr (535.51 grams), 1 mole of KCl (111.89 grams) as the cathode-side electrolyte solution and 3 moles of ZnBr2 (675 grams), 1M of ZnCl2 (205 grams), and 1 mole of KCl (111.826 grams) as the anode electrolyte solution [53,54].
The cathode electrolyte solution contains 3 moles of KBr (535.51g), 1 mole of KCl (111.89g). The anode electrolyte solution contains 3 moles of ZnBr2, 1 mole of KCl and 1 mole of ZnCl2. Both electrolytes solution contained 24.1g of Sodium Bromoacetate acid and Bromoacetic acid and 240g of MEM-Sequestering agent.
Conclusion and Future Work
The fabricated ZnBr2 cell chemically converted to a CuZn2 battery cell due to the non-chemically fitted brass materials coupled to the fabricated battery cell according to the investigated brown deposits within the cathode-side electrolyte observed to be copper and further to the explored SEM analysis on some of the electrodeposited charged zinc particles incorporated within the anode-reactor. The outcome of the results encouraged interrupting the cell from operating further and led to pulling apart the cell components to be properly cleaned and the sieving separation technique carried out on the cathode and anode electrolyte solution due the escaped charged zinc-particles.
Furthermore, as previously mentioned the possibility to revert the cell back to a zinc-bromine battery cell from a copper-zinc battery cell had occurred by changing the brass fitting materials (BFM) to a plastic fitting material (PFM). The observed brown deposits which had converted the zinc-bromine batteries cell to a copper-zinc battery cell was only possible to be reverted to a zinc-bromine battery cells by carrying out repeatedly a filtration process to separate the sediments observed from the anode and cathode electrolyte solution.
Initially by not fabricating the Nafion membrane size to the actual length and cell breadth size (190mm*190mm), had supported allowing the anode and cathode electrolyte to mix. Therefore, fabricating the membrane size to a cell shape will prevent any future occurrence from allowing any cross-mixing of any anode-side and cathode-side electrolyte.
By using a UV-visible spectrophotometer device to detect why the cathode-side electrolyte did not change to a reddish brown or yellow colour during the charge rate and discharged rate after identifying a dark green coloured electrolyte at the cathode-side cell; which was recognized as copper at a wavelength of 900nm and with two peaks (see Figure 7a & 7b) had also supported having the establishment of a good redox reaction according to the electrochemical results according to the experimental observation. Furthermore, see Figures 1 & 7b. Therefore, identifying the chemistry behind the electrolyte colour had further helped.
The presence of oxygen (O2) was agreed to have occurred because the cell was exposed before coupling it and due to the presence of H2O. Silicon has originated due to the applied adhesive glue to prevent leakages. Chromium (Cr), Iron (Fe) and carbon (C) were both produced due to the coupled anode-inlet and anode-outlet pipe steel materials and brass fittings that were not chemical resistance. The anode and cathode inlets and outlets brass fittings materials had supported the origination of the identified selenium element during the chemical reaction. Selenium as non-metallic chemical elements in the group xvi of the periodic table could conducts electricity better in the light than in the dark and used in photocells. It was not peculiar by identifying some potassium elements during the SEM since the cell electrolytes consisted of some added salt.
To Know More About Trends in Technical and Scientific Research Please click on:
To Know More About Open Access Journals Please click on:


Comments
Post a Comment