Juniper Publishers - Effect of Operational Conditions on Performance of Deep Sand Filter in Turbidity Removal
Trends in Technical & Scientific Research
Abstract
In this study, laboratory pilot plant was constructed to study the performance of deep sand filter in water treatment. Sand was used as a filtration media under different filtration rates ranged from 4 m/hr to 8 m/hr. Down flow was applied to the filter through sand media with size of 0.7-1.0 mm, while sand depth was changed from 80 cm to 140 cm. The used synthetic turbid water was prepared in different turbidity levels varying from 10 to 30 NTU. Aluminum sulfate (alum) was used as coagulant in different doses varied from 20 to 40 mg/l. Turbidity removal and head loss were investigated as functions of sand depth, filtration rate, alum dose and influent turbidity. From analysis of the experimental results, it was found that the changing of operational conditions (changing media depth, filtration rate, alum dose and influent turbidity) have significant impact on the turbidity removal efficiency, head loss and ripening period. Also, the effective depth of media is influenced by operational conditions and its value was obtained in this paper.
Keywords: Deep sand filter; Effective depth; Filtration rate; Head loss; Turbidity removal
Introduction
With an exponentially increasing of population, better and more economical water treatment methods and strategies have become the need of the hour. One such sustainable water treatment method is using deep bed filters which has great potential for treating of contaminants in drinking water [1-3].
Deep bed filtration is an effective process in removing particles from water. This is achieved by passing the suspension through a deep layer (usually between 0.5 m and 2.0 m depth) of granular material, typically sand. The suspension particles are retained within the depth of the filter media. This removal may be achieved by different mechanisms [4-6].
In filtration process, there are different stages, ripening, working, and breakthrough stage [7]. The removal efficiency during ripening stage increases, while this efficiency is nearly constant during working stage. Then the removal starts to deteriorate in breakthrough stage [8]. During ripening period, the effluent turbidity is relatively high. It takes some minutes to be allowable [9]. The effluent water during this period is mostly wasted thus this period has significant effect on the quantity of water. This period has been studied in many researches [10-13], but the effect of different operational conditions on this period was not clear. So, this paper will study that effect.
Numerous empirical equations, which are used to predict initial filter head loss, have been developed. Some commonly used equations are Carmen-Kozeny, Ergun, Fair-Hatch, Hazen, Rose, and Gregory equations [14,15]. These equations may be unacceptable for specific types of media such as crumb rubber. it was found that Both the Kozeny and Ergun equations were unacceptable for clean-bed head loss prediction in crumb rubber filters [16]. A neuro-fuzzy model was conducted to estimate head loss in dirty sand filters. Hydraulic loading rate, influent iron concentration, bed porosity, and operating time were selected as input variables [17].
Many researchers studied the deep bed filter and its performance. One of these studies showed that the removal efficiency during the ripening stage of filtration can be improved significantly by increasing the ionic strength of the water to be treated [18]. In addition, the structure of porous media (i.e., pore size distribution) has a clear effect on deep bed filter performance [19]. Moreover, impact of backwash procedures on deep bed filtration productivity in drinking water was presented [20]. From modeling point of view, many models were introduced to explain the efficiency and performance of deep bed filters, [21-25].
Through deep bed filters, not all used media depth is effective in turbidity removal but there is an effective depth which give the required or permissible limit. The effective depth for media from burned oil palm shell granular has been obtained [26]. Moreover, knowing the effective depth of turbidity removal will assist in identifying depth of the sand during filter design.
Using granular sand filters has a limitation of influent quality. When it used with drastic influent quality with small depth it don’t give the required quality. Therefore, another technique is required such as using deeper filter. The main objectives of this study is to investigate the effect of operational conditions on the performance of deep sand filter and to determine the effective depth for turbidity removal.
Materials and Methods
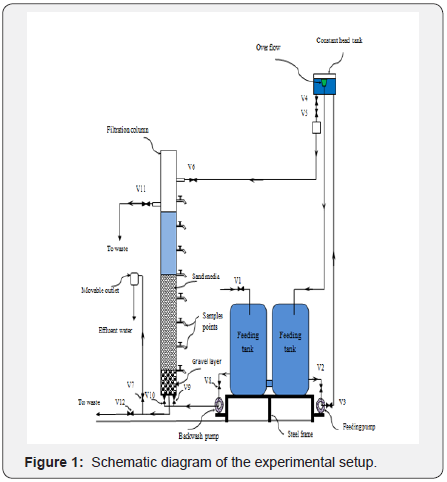
For this study, a Laboratory pilot plant was designed and constructed in the laboratory of sanitary engineering in the faculty of engineering – El- Mansoura University, Egypt. Figure 1 shows the schematic diagram of the laboratory pilot plant.
Experimental set up description
It consisted of the following main parts: -
a. Feeding tanks: The synthetic turbid (raw) water was prepared in four plastic feeding tanks. The four tanks divided into two groups each group consist of two tanks. The capacity of each tank was about 250 liters.
b. Feeding pump: The synthetic turbid water was transported from feeding tanks to a constant head tank by feeding pump. The horsepower of pump were 0.45 HP (Discharge 0.45 m3/hr).
c. Constant head tank: The raw water has been fed from the feeding tanks to the sand filter via a constant head tank. The capacity of constant head tank was 45 liters and has dimensions of 30 * 30 * 50 cm. Constant head tank has confirmed a constant discharge to the plant whatever the difference in water levels before and after it.
d. Filtration column: The major part of the laboratory pilot plant was the filtration column. The filtration column was made from galvanized steel with height 2.5 meters. The column consists of two parts each part 1.25 m height and it has square cross section (20 *20 cm). The filtration column has one glass face to allow monitoring what is inside the column. Along the filtration column several connection points were fixed each 20 cm as samples ports.
e. Backwash Pumps: Two pumps were used for backwashing. The horsepower of each pump were 0.45 HP (Discharge of each pump 0.45 m3/hr).
f. Piezometers: Manometer tubes installed behind filtration column to determine the head loss through the filtration media depth at different times.
g. Fittings and Plastic connecting pipes: There were different service connections such as elbow, tee, reducer and connecting pipes with different diameters due to its location and use.
Filter media
In this study, the filtration media was uniform sand media rested on the gravel layer. The sand depth in the filtration column was changed from 80cm to 140cm with size of 0.7- 1.0mm and its porosity was 0.38. The dry density of the sand was 1.65 gm/cm3 and its specific gravity was 2.55. The gravel depth under the sand was about 20cm with different sizes ranged from 2.0mm to 9.0mm. The gravel layer is located immediately below the filter sand media to separate the filter media from the underdrain system, to prevent media particles from clogging the underdrain orifice, and to dissipate the backwash water jets from the orifice of the underdrain system [27,28].
Synthetic raw water
By using fine clay soil and tap water it was able to achieve the synthetic raw water which can be used in the experimental work. The raw water was prepared by dispersing fine clay, having a size less than 0.074mm, in tap water. In this research, the synthetic raw water turbidity was ranged up to 30 NTU which is a suitable range in the River Nile and its branches in Egypt.
Laboratory pilot plant operation
This study has been extended to cover the various operation conditions for the sand bed filter. In present research, different positions for Aluminum sulfate (alum) feeding were tested as a coagulation process. it was found that feeding alum dose in feeding tanks gives high filtration efficiency with doses varied from 20 to 40mg/l. The operation of the laboratory pilot plant was controlled by 12 valves (shown in Figure 1). These valves facilitate two modes of filter operation (down flow filtration mode and filter backwash mode).
a. Filtration mode: The experimental runs were conducted under the conditions of a direct constant filtration rate. The operated filtration rate was changed from 4m/hr to 8m/hr (suitable for rapid sand filter). The effluent turbidity was measured at different depths each 1 minute for the first 30 minutes (to assess the ripening period) then it was measured each one hour throughout the remaining part of the run. The turbidity of influent and effluent water was measured by using turbidimeter in Nephelometric Turbidity Unit (NTU). Its model is Orbeco TB300-IR Lab Turbidimeter. In addition, the head loss through sand media was measured by Piezometers each one hour. The effluent turbidity measurements at different depths will help in determining of effective sand depth and developing of simplified model for filter efficiency.
b. Backwash mode: The end of filtration run was considered when effluent turbidity started to increase (turbidity breakthrough) or head loss reaches the maximum value or the run length reaches defined period (in this research, one day). Once either of this condition was reached, the filter run was terminated and the filter needs to backwash mode to remove the accumulated solids inside its bed [29,15]. Water only with high rate (50m/hr) was used as a backwash method [30]. The backwash period was extended to 18minutes and during this period, the wasted backwash water turbidity was measured each 1 minute to appraise the required backwash duration.
Various runs were conducted under different operational conditions (varying the media depth, filtration rate, influent turbidity and alum dose) to study the performance and get the effective depth for deep bed sand filter.
Results and Discussions
Ripening period
In this study, the effluent turbidity within the first 30 minutes was measured at each of tested filtration rates (4, 5, 6, and 8m/hr) and through the different media depths (80, 100, 120, and 140cm). The results were obtained with 3 different influent turbidity (10, 20, and 30 NTU). The coagulation process was done by using alum with different doses (20, 30, and 40mg/l). the effluent turbidity was observed until it reaches the acceptable limit in the Egyptian drinking water code (1 NTU) to obtain the ripening period. Figure 2 shows the effect of increasing media depth on the ripening period for 10 NTU influent turbidity and alum dose of 40mg/l. As shown in that figure, the effluent turbidity in the beginning of filtration run was nearly 1 NTU and this turbidity was due to the remaining backwash water in the underdrainage system. The turbidity increases over few period of time nearly 4minutes. This increase was due to not removed particles that were dislodged from the media during backwash [10]. At nearly 4 to 5 minutes the effluent turbidity reaches its maximum values and these values vary according to the filter media depth. The reason for increasing turbidity to this degree is that influent water enters the filter and mixes with the backwash remnant water in the upper region of the filter. This is consistent with the results in paper for Colton et al. [31] which showed that the collapse pulsing duration was 4minutes. Then the effluent turbidity decreases until it nearly becomes constant where the media is able to capture newly influent particles [32].
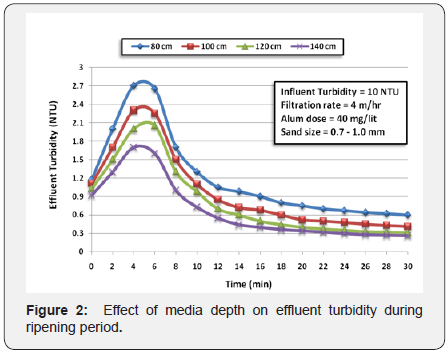
From Figure 2, it was obvious that the effluent turbidity reaches 1 NTU after 12minutes when the sand media depth was 80cm. If the sand media increased to 140cm, the ripening period will be virtually 7 minutes. This means that increasing sand depth from 80cm to 140cm reduced the ripening period by 42%. So, it help in increasing of water treatment plant production. The effluent turbidity was influenced by increasing filtration rate as shown in Figure 3. When the filtration rate increased to 5m/hr the required ripening period increased. At sand depth of 140cm the required ripening period was 10minutes, while depth of 80cm gives the required turbidity after 32minutes. In addition, the ripening period in case of 100cm depth was 18minutes but in case of 120cm depth the ripening period becomes 13minutes. Increasing filtration rates may result in an inability to use a small depths as shown in F igure 3 . A t f iltration r ate o f 6m/hr t he e ffluent t urbidity reaches the acceptable limit after nearly 18, 25 and 40minutes with sand depths of 140, 120 and 100cm respectively. But depth of 80cm can’t be used due to its ripening period. This is due to increasing filtration rates resulted in greater shearing actions within the media pores, which enhanced the transport of deposited turbidity matters through the filter bed. With increasing filtration rate to 8m/hr, media depth of 100cm can’t give acceptable effluent turbidity. Figure 3 summarizes the required ripening period for each sand depth at different filtration rates. Also, this figure shows that the influent turbidity has significant effect on the ripening period. Figure 3 show great effect of operational conditions on ripening periods, so it could be guided in determining either ripening periods thus the productivity of treatment plant or required media depth at different filtration rates and influent turbidity.

Head loss through filter run
Head loss is a loss of pressure (also known as head) by water flowing through the filter media. In the current study, the head loss through filter media depth was measured for different filtration rates and various influent turbidity with alum doses 20, 30, and 40mg/l. Figure 4 shows the variation of head loss along run time at filtration rate of 5m/hr and alum dose of 40mg/l for different depths of sand media. It was noticed that the observed head loss values were close to the calculated head loss from Hazen equation and Kozeny equation for sand depth from 80cm to 140cm. It was noted from the experimental observations that the alum dose variation has not vital effect on the initial head loss at the same depth and filtration rate. but it has significant effect on the increasing rate of head loss with run time. Further, increasing filtration rate increases the increasing rate of head loss. From Figure 4, the head loss value after 24hours of run was nearly 110cm at sand depth of 140cm and filtration rate of 5m/hr. This means that using deep sand filter up to 140cm have not a critical impact on head loss value.
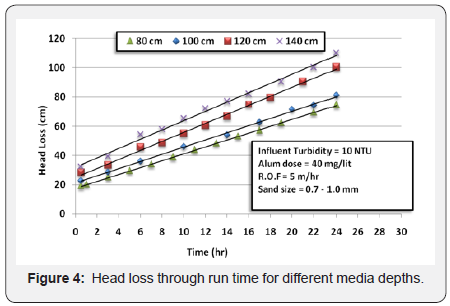
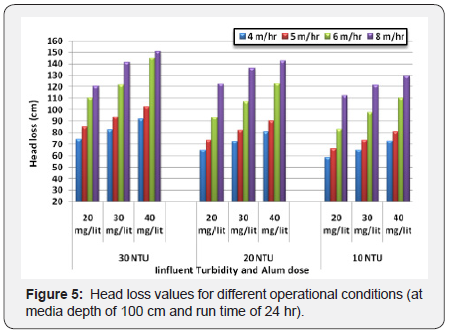
Figure 5 shows the observed head loss at specific time (24 hr) for sand depth of 100cm at different filtration rates. It also shows the effect of changing alum dose and influent turbidity on head loss values. It was noticed that the head loss increased from 58.7 cm to 72.9cm by increasing alum dose from 20mg/l to 40mg/l at filtration rate and influent turbidity of 4m/hr and 10 NTU respectively after 24hours of run. In addition, at filtration rate 8m/hr, increasing alum dose from 20mg/l to 40mg/l increased the head loss from 112.4cm to 129.5cm. Thus, the effect of increasing alum dose on head loss at high rates is more obvious than low rates. Figure 5 shows also the impact of raw water characteristics which represented in influent turbidity on head loss. It was noted that increasing influent turbidity from 10 NTU to 30 NTU increased head loss from 81cm to 102.5cm at filtration rate of 5m/hr and alum dose of 40mg/l. This is due that raw water with high turbidity which contains larger number of suspended particles leads to increasing of shear action when flowing through sand grains. This shear action increases with increasing filtration rate so the effect of influent turbidity on head loss at high rates is more significant than at low rates as shown in Figure 5.
Turbidity removal efficiency and effective depth
Deep bed sand filter is usually characterized by filtration efficiency, which determines the level of removal of particles from influent water. The turbidity removal efficiency was measured in the present study under various operational conditions. Figure 6 shows the turbidity removal efficiency with depth at different rates. The removal efficiency was measured as the following equation:

Figure 6 shows the removal efficiency with alum dose 20 mg/l through different sand depths at 4, 5, 6 and 8m/ hr filtration rates. It was clear that increasing media depth increases the removal efficiency where at 20cm depth the removal ratio was 78.4% while at 140 cm depth the ratio of removal increased to 94.7%.
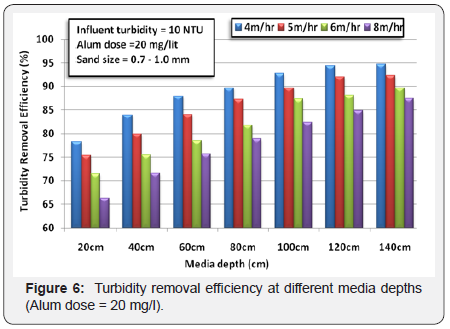
Increasing filtration rate decreases the turbidity removal efficiency, where at 20cm depth, the removal percents for 4, 5, 6 and 8m/hr were 78.4, 75.35, 71.43 and 66.3% respectively. If the depth of media equals 140cm, the removal percents will be 94.7, 92.36, 89.72 and 87.41% at the previous rates respectively. It was also noticed that sand depths less than 100 cm have drastic variation in turbidity removal efficiency, while depths more than 100cm have slightly variation in removal efficiency at low filtration rates.
Increasing alum dose from 20mg/l to 40mg/l has significant impact on the percent of removal. Figure 7 show the removal efficiency at alum dose 40mg/l with different sand depths at 4, 5, 6 and 8m/hr filtration rates. This figure also confirms that the efficiency of removal increased by increasing sand depth and decreasing filtration rate. The removal efficiency at 20cm depth was 78.4% with alum dose of 20mg/l but 82.7% with alum dose 40mg/l. In case of depth 140cm, the efficiency was 94.7% with alum dose 20mg/l but 97.9% with alum dose of 40mg/l. This means that increasing alum dose enhanced the coagulation process so it increases the percent of removal, but it occurs at a certain limit of alum. After this limit, any increasing of dose has no effect.
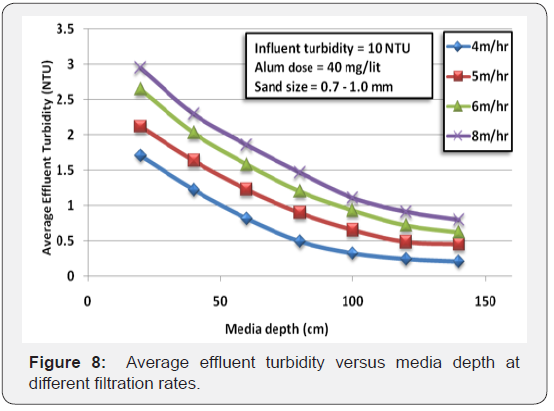
After knowing turbidity values at different depths with various rates and various influent turbidity, effective depth of sand could be determined. The effective depth is the smallest sand depth which give the allowable limit of turbidity (>1 NTU). The effective depth is determined as shown in Figure 8 as following:
1. Plotting the average turbidity at different depths for each filtration rate.
2. Identify the permissible or required limit of effluent turbidity (1 NTU).
3. The intersection points at each rate could give the effective depth.
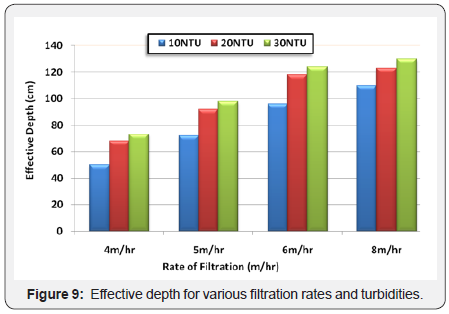
Figure 9 summarizes the effective depth for each rate with influent turbidity 10, 20, and 30 NTU. The results in the figure were obtained when the alum dose was 40mg/l, which gives high removal efficiency.
From Figure 9, it was observed that sand depth of 50cm was more suitable for filtration rate 4m/hr and influent turbidity 10 NTU. To increase the filtration rate to 8m/hr, it was needed to increase the sand depth to 110 cm. For influent turbidity 30 NTU, 73 cm depth was suitable for 4m/hr filtration rate whereas 130 cm depth was suitable for 8m/hr filtration rate. Moreover, at filtration rate 8m/hr and influent turbidity less than 30 NTU, 130 cm sand depth is sufficient to give acceptable limit of effluent turbidity. From these results, in order to double the filtration rate nearly 60 cm of sand should be added to the existing depth. Since the filtration rate commensurate inversely with filter area so the filter area could be reduced by increasing sand media depth.
Backwash period
In the current study, backwash rate of 50m/hr was used, which expands the media 20 percent. This rate was in recommended range by AWWA [30]. The backwash period extended to 16minutes until the effluent backwash water turbidity became acceptable. The effluent turbidity during backwash was measured and plotted as shown in Figure 10. The wasted effluent turbidity was very high during the first two minutes. It exceeds 700 NTU then it begins to come down to reach 10 NTU in average after 6 minutes. From 6 minutes to the end of backwash period, there is slight decrease in effluent backwash turbidity. Changing sand media depth from 80 cm to 140 cm has small effect on the backwash period and duration of 15 min is sufficient for backwashing whatever the depth of media, as shown in Figure 10.
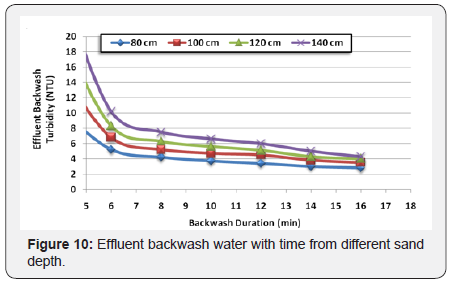
The value of required backwash duration was close to reported value in previous studies [33,34]. During backwash mode, Turbidity (4-5 NTU) was left in the backwash stream at cutoff to preserve the bed ripening and allow the filter to produce quality effluent more quickly for the followed run as it was recommended by Pizze [35].
Conclusion
From experimental results, it was noted that, Changing operational conditions (increasing media depth, filtration rate, influent turbidity, and alum dose) have significant impact on ripening period of filter, head loss, and turbidity removal efficiency. This study also shows the effective depth for different rates and it was proportional with influent turbidity and filtration rate directly. The effective depth could be changed by changing the nature of influent water and sand media size. From the head loss results, it was noted that increasing rate of head loss is influenced by alum dose, filtration rate and influent turbidity. Moreover, using deeper sand filter helps in treatment of high turbidity water under high filtration rate and it can reduce the area of filters.
To Know More About Trends
in Technical and ScientificResearch Please
click on:
https://juniperpublishers.com/ttsr/index.php
To Know More About Open Access Journals Please click on:
https://juniperpublishers.com/index.php


Comments
Post a Comment