Juniper Publishers: Olive (Olea europaea L.) of Jerusalem in Palestine
Juniper Publishers-
Trends in
Technical & Scientific Research
Abstract
The olive (Olea europaea L., Oleaceae) is the most important fruit tree found before more than 6000 years, which contributes to the increase of the agricultural national product in Palestine, and therefore plays a role in increasing the Palestinian economy. Methodology, we analyzed data on environmental factors of Jerusalem (East Jerusalem), including climate and bioclimate, using the bioclimate classification for the earth of Salvador Rivas Martinez during study period 1993-2012, which we obtained from the Palestinian Meteorological Station and the same period of olive production (rainfed) from the Palestinian Central Bureau of Statistics. Result and discussion, when we used a correspondence analysis (CA), observed that Jerusalem affected negatively by bioclimate factors as annual ombrothermicindex and simple continentality index during the years (1993-1997), whilst, the effect was positive for years (1997-2012), with a large proportion of the variance explained by axis F1 (96.81%), axis F2 (2.88%) and axes F1and F2 (99.100%). Furthermore, in Jerusalem, the optimum of mean monthly temperature for increased olive production is between 15-200oC, with the result of annual ombrothermic index value more than 3.5, compensated thermicity index (210/210 to 350/350), simple continentality index between (15-20). Addition to olive production favor, where the environmental areas thermomediterranean to mesomediterranean of thermotype and dry to humid of ombrotype, and Jerusalem is belonging to mesomediterranean of thermotype and dry to sub humid of ombrotype.
Introduction
Posture problems in youth is rising right under your nose. Are you a parent reading this article? Do you suffer from neck or back pain after a long day at work? Headaches maybe? Did you wake up with pain? Maybe you didn’t, but the other 65% of working population did, dose and do go thru their days in discomfort. You don’t stop eating because you are afraid of cavities? Then why do you expect the millennial to give up their smart devices? How many children do you see already in poor state of health? How many do you know personally? Just like cavities, using smart devices puts us at risk. It’s not about “What is wrong?” it’s about how are were reacting to it individually? What is the compelling reason to make a change before becoming the victim of the consequences?
Methodology
Study area
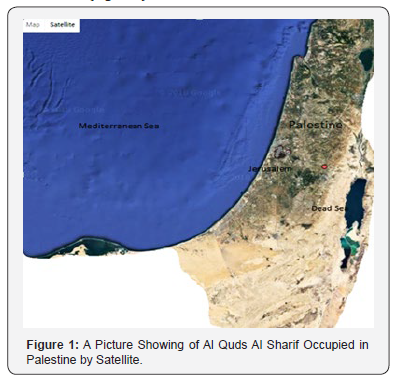
Jerusalem is a Palestinian city built by the Canaanite Arabs more than 6,000 years ago, occupied more than 18 times throughout history, and the last time by Israel in two stages, the first phase in 1948, was called West Jerusalem, and the second in 1967 (Six-Day War), was called East Jerusalem (people Palestinian area). Finally came the promise of the unjust US President Donald Trump to devote the occupation of the city and considered it the capital of Israel and not the right of the Palestinians, but in fact Jerusalem is the capital of occupied Palestine and one of the holiest cities in the world, the United Nations and the international community do not recognize Jerusalem as the capital of Israel. East Jerusalem is considered part of the Palestinian territories and is not recognized as a Jewish state [25], it is 760 meters above sea level and 64km2 , with coordinates 31.76°N 35.25°E, the city of Jerusalem is located in the center of Palestine, which is about 1km away from the Mediterranean, about 11 km from the Dead Sea, bordered on the eastby the city of Jericho (Jordan Valley, Jordan River and Dead Sea), and on the west by the towns of Ramle and Lod (Meditrranean Sea), on the north by Ramallah and from the south Bethlehem and Hebron cities (Figure 1).
data
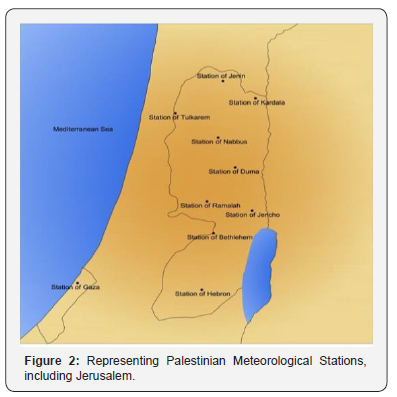
In this paper, both climatic and bioclimatic factors were analyzed, data were obtained from the Palestinian meteorological station (Figure 2), with analysis of the olive production data for the city of Jerusalem obtained by the Palestinian Central Bureau of Statistics (PCBS) and for the same years of study for both environment factors and plant production (1993-2012) (Table 1).The analysis of climate and bioclimate factors was done using the Salvador Rivas Martinez to classification of the earth [26-30], and climate factors were consisted of mean monthly temperature (Tm), precipitation (P or ppt) and soil water reserve (R); and bioclimatic factors or variables as compensated thermicity index (It/ Itc), annual ombrothermic index (Io), simple continentality index (Ic) and water deficit (Wdf or Df). Annual ombrothermic index, Io = Pp/ Tp, where is Pp = positive precipitation and Tp = positive temperature (in this case equivalent to annual precipitation and mean annual temperature divided by 12, as all the months have an average temperature above 0; bimonthly summer ombrothermic index, Is2 = P July + August/T July + August; trimonthly summer ombrothermic index, Is3 = P June + July + August/T June + July + August; and simple continentality index (Ic) = Tmax-Tmin, Tmax = maximum temperature of the averages of the warmest month of the year, and Tmin = minimum temperature of the averages of the coldest month of the year; thermicity index, where applicable compensated thermicity index, It/Itc = (T + M + m)*10, where is T = average temperature of the months; T = mean monthly temperature; M = average of the maximum temperature of the coldest month of the year, and m= average of the minimum temperature of the coldest month of the year, and P = precipitation of the months indicated.
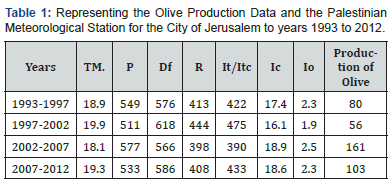
Yield: Kilogram/dunum; T or Tm: Mean Annual Temperature; P or ppt: Precipitation; R: Soil Water Reserve; Df or Wdf: Deficit water; Io: Annual Ombrothermic Index; Ic: Simple Continentality Index; and It/Itc: Compensated Thermicity Index; and Olive Production.
Exploratory data analysis
Further, we also used normality tests for Jarque-Bera and Shapiro-Wilk to conduct the analysis [31-34], and we applied an analysis of variance (ANOVA) tests analysis to each of the eight environmental variables as climate and bioclimate factors and olive production, four bioclimatic parameters and the three climate variables or climate factors to obtain the principal component analysis, factor loading, adjusted r-squared, standardized coefficient and regression coefficient (R2) to determine the impact of environmental variables on plant yield. Addition to, exploratory data analysis was used to determine the most related environmental variables for the olive, and the XLSTAT software program were used done. Furthermore, we can use the adjusted r-squared formula is:

where: N is the number of points in your data sample, and K is the number of independent repressors; and linear regression is a way to illustrate the relationship between two variables. The equation has the form Y= a + b X, where Y is the dependent variable, X is the independent variable, b is the slope of the line and a is the y-intercept.
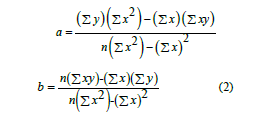
A regression coefficient is the same as the slope of the linear regression equation, and the formula of the regression coefficient that is: B1 = b1 = Σ [ (xi – x) (yi – y)] / Σ [ (xi – x)2]. “y” in this equation is the mean of y and “x” is the mean of x.

Yield: Kilogram/dunum; T or Tm: Mean annual temperature; P or ppt: precipitation; R: Soil water reserve; Df or Wdf: Deficit water; Io: Annual ombrothermic index; Ic: Simple continentality index; and It/Itc: Compensated thermicity index; and olive production.
Result and Discussion
Impact of climate & bioclimate factors on olive production
Principal component analysis (PCA):After we analyzed the climate and climate factors using the Salvador Rives Martinez methodology [29,30], and applied the natural tests of Jarque - Bera and Shapiro-Wilk [31-34], and finally the XLASTAT Software program, the probability value obtained from the studied variables tends to be less than 0.05, which is traditionally acceptable. PCA is used as a in exploratory data analysis, factor loading, standard deviation, covariance, eigenvalues, eigenvectors and other values.
Eigenvectors and eigenvalue:In linear algebra, eigenvector of a linear transformation is a non-zero vector that changed only by a standard factor when that linear transformation is applied. Eigenvalues and eigenvectors using either the methods of matrices or the linear transformations [35,36]. Further, calculate of the eigenvectors and eigenvalue given by: Let M be an n × n matrix. A is there is a nontrivial solution x of Ax = λx. Where, V is an eigenvector of M, if M (v) = λv, λ is called the eigenvalue associated with v. For any eigenvectors v of M and scalar a, M × av = λav. Thus, we can always choose eigenvectors of length 1:

If M has any eigenvectors, it has n of them, and they are orthogonal to one another, thus eigenvectors can be used as a new basis for an n-dimensional vector space, and AX = λX, for some scalarscalar λ. The scalar λ is called an eigenvalue of A, and x is called the eigenvector of A corresponding to the eigenvalue λ.
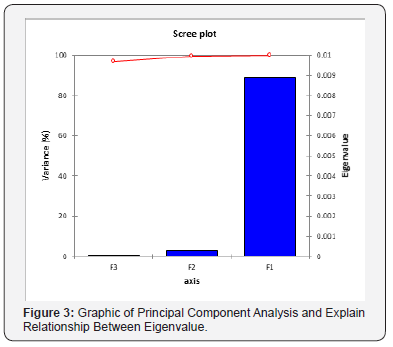
Factor loading analysis:However, principal component analysis was used to help determine various variables, using the extract factor with eigenvalue > 1 after varimax rotation. The results of PCA, including eigenvalues with a varimax rotation and the factor loadings, are classified in (Table 2) and (Figure 3), there are three of the eigenvalues were found to be >1 (Figure 3). While the total variance for these factors are about (99.60%), and two of the eigenvalues were found to be ˃ 1 and the total variance for the two factors (F1 and F 2) are about (99.60%), as in the (Figure 4). Otherwise, we applied the coefficient of correlation between all environmental variables and factors, and the correlation coefficient is bound to the range of ± 1, the +1 value inform us that the points (xi, yi) determine a straight line with a positive slope, a value of -1 inform us that it specify a straight line with a negative inclination, while the value 0 indicates that there is no correlation of y on x or vice versa.
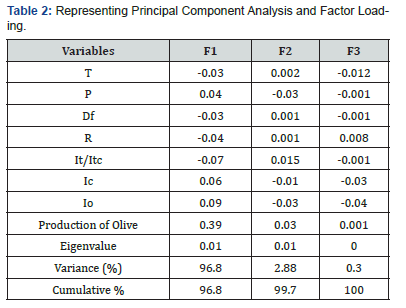
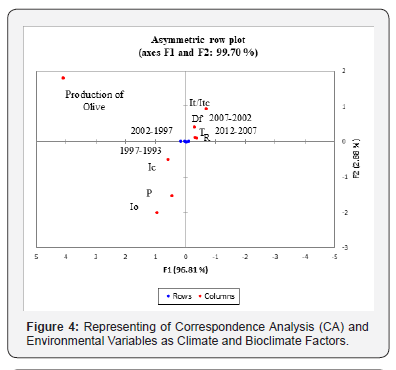
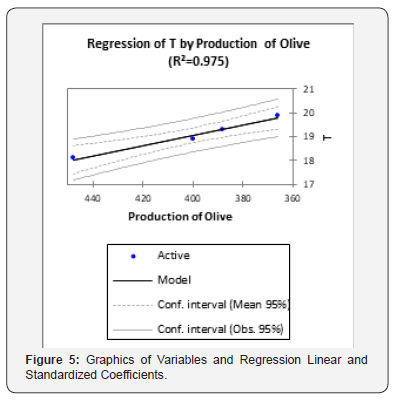
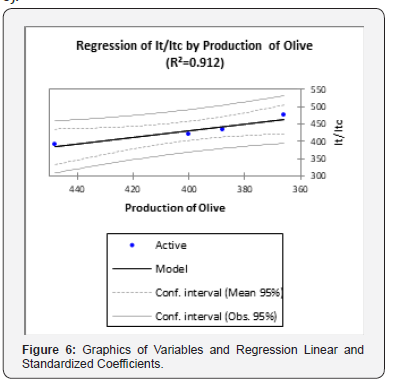
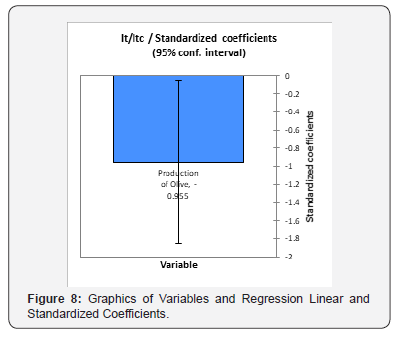
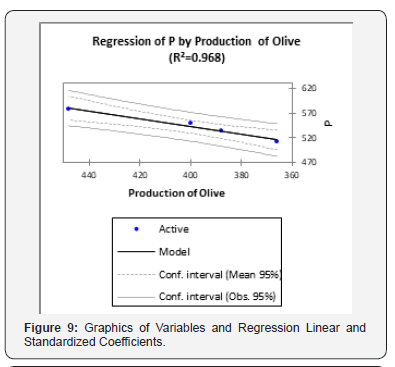
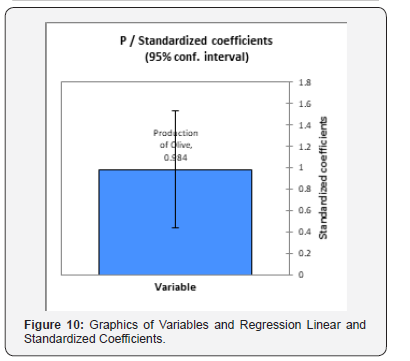
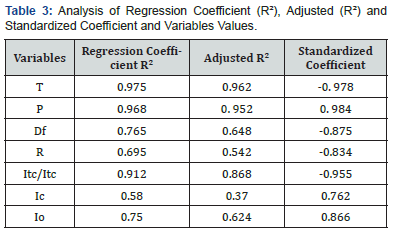
The factor 1 was dominated positively by the factors of precipitation (0.04), simple continentality index (0.06), and annual omrothermic index (0.09), except water deficit, compensated thermicity index, and mean monthly temperature are dominated negatively (-0.03, -0.07 and -0.03) and accounts for 96.8% of the total variance and cumulative (Figure 4). Factor 2 is a high dominated by mean monthly temperature (0.002), soil water reserve and deficit water (0.001), compensated thermicity index (0.015), while precipitation (-0.03), simple continentality index (-0.01), and annual omrothermic index (-0.03) were dominated negatively. Factor 3 is a dominated positively by soil water reserve (0.008), but with negatively impact for the rest of factors, as reported in the (Table 2).On the other hand, when we applied a correspondence analysis (CA), observed that Jerusalem affected negatively by annual ombrothermicindex and simple continentality index as the bioclimate factors and precipitation as climate factors during the years (1993-1997) because its lies in the negative y-axis (Figure 4), whereas, the effect was positive during the years of study from (1997-2012), with a large proportion of the variance explained by axis F1 (96.81%), while axis F2 (2.88%) and symmetric plot axes F1and F2 (99.60%), this is evident in (Figure 4). Otherwise, the analysis of variance (ANOVA), with a 95% confidence interval has been applied to olive yield, with the seven environmental variables (Tm or T, P or ppt, R, Df or Wdf, Io, Ic and It/Itc), explain significant differences in olive production, impact of these factors on the olive productivity. The results of the analysis for each of regression coefficient, standardized coefficient, and adjusted R² showed that there was a difference significance in this study, in case of olive productivity shows a better regression coefficient with value of mean monthly temperature and compensated thermicity index (R2 = 0.975 and 0.912), adjusted R² (R2 = 0.962 and 0.868) respectively, being closed to 1 (Figure 5 & 6), and negatively with the standard coefficient (-0. 978 and -0.955), because the histograms were negative (Figure 7 & 8); precipitation is a better linear regression or regression coefficient and adjusted R² with the values of (R2 = 0.968, 0. 952) respectively, being closed to 1 (Figure 9), and correlated positively with the standard coefficient (0.984), because the histograms is positive (Figure 10), and the rest of variables and regressions values as tabulated in the (Table 3).
Olive in jerusalem
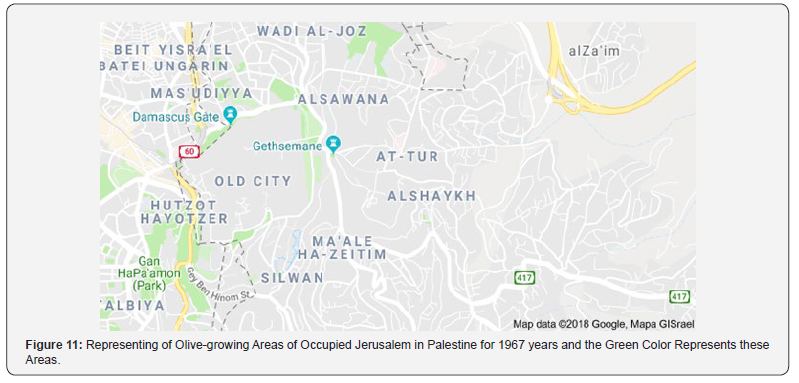
Jerusalem known by other names in Arabic such as: Biet Al-Magdis, Al-Quds Al-Sharif, and the old city of Jerusalem was known in the city of Zeitoun. Historically, their ancestral ancestors the Jebusites were the first to build and inhabited the city inthe fifth millennium BC. Now, the most important olive growing areas in Jerusalem: Beit Hanina, Beit Safafa, Kafr Aqaba, Shuafat, Jabel Mukaber, the French Hill, Jabal Al-Musharraf, Sheikh Jarrah, Wadi Al-Joz, Old City, Sur Bahir, Silwan, and Mount of olives (East Jerusalem) (Figure 11). Mount Olive or Tur is one of the oldest Palestinian villages in Jerusalem, located east of the Old City of Jerusalem, the Mount of Olives is the highest area in Jerusalem with a height of 826 meters above sea level and other areas in West Jerusalem have been under Israeli control since 1948, although they now control all areas of East and West Jerusalem. The area of olive trees (rainfed) Palestine was 893,721 dunums, and the productivity was 92kg/dunum, while the city of Jerusalem (East Jerusalem) was area of about 11,664 dunums, production (1400ton), and productivity was about 120kg/dunum during 2007/2008 [37], while the olive productivity in Jerusalem amounted to about 100.5kg / dunum during the year 1993-2012. The main olive varieties used in the Palestinian territories are: Shamali, Jabbah, Mantelino, Nabali Baladi, Nabali Mohsen, Shami, Suri, and Rumi [8,38].

Impact of temperature on olive
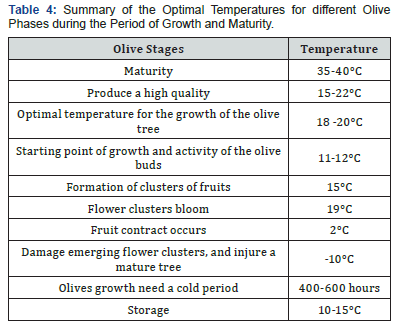
The temperature has a significant impact on the production [39], physiology [11-13], biology and sustainability of plants [40-42], where the olives growth need a cold period between 400-600 hours yearly, the starting temperature of olive growth is between 11-12°C, the optimal temperature for the growth of the olive tree ranging between 18 -20°C [4,5], the formation of clusters of fruitsat 15°C, flowers bloom starting at 19°C, the fruit contract occurs at 21°C, and the ripening temperature of fruits ranges from 35- 40°C, while the best storage temperature is between 10-15°C., as reported in the (Table 4).
Conclusion
Olive has a great economic importance that affects the Palestinian society as the largest and most important crop of fruit quarry in terms of area, number and production. The olives were found in Jerusalem and Palestine from more than 6,000 years ago, and it is believed that Palestine is the world’s olive origin and were mentioned in the Quran seven times. On the other hand, when we used a correspondence analysis (CA), observed that Jerusalem affected negatively by bioclimate factors as annual ombrothermicindex and simple continentality index during the years (1993-1997), whilst, the effect was positive during the years of study from (1997-2012), with a large proportion of the variance explained by axis F1 (96.81%), while axis F2 (2.88%) and axes F1and F2 (99.100%). However, in Jerusalem, the optimum of mean monthly temperature for increased olive production is between 15-200C, precipitation more than (600mm), with the result of annual ombrothermic index value more than 3.5, compensated thermicity index (210/210 to 350/350), simple continentality index between (15-20). Addition to olive production favor, where the environmental areas thermomediterranean to mesomediterranean of thermotype and dry to humid of ombrotype, and Jerusalem is belonging to mesomediterranean of thermotype and dry to sub humid of ombrotype.
To Know More About Trends
in Technical and ScientificResearch Please
click on:
https://juniperpublishers.com/ttsr/index.php
To Know More About Open Access Journals Please click on:
https://juniperpublishers.com/index.php


Comments
Post a Comment