Exploring the Response Time (RT) in Performing Specified Visual Search Tasks - Juniper Publishers
Journal of Trends in Technical and Scientific Research
Abstract
The ability to identify for a targeting object among
other many similar objects is essential to human cognition. The process
of object recognition underwent complex cognitive ability and may vary
on some factors such as the feature between the target and non-target.
Anne Treisman’s Feature Integration Theory (FIT) was used as the
blueprint theoretical model to guide the present assignment [1]. The
current experiment adopted the classic and simplest visual search
paradigm to explore the response time (RT) in performing the specified
visual search task. The present pilot run also sought to fill the
research gap in studying gender difference in the visual searching task
to the existing literature [2].
Keywords: Visual search; Cognitive ability; Feature integration theory; Response time; Gender difference
Abbreviations:
FIT: Feature Integration Theory; RT: Response Time; BPS: British
Psychological Society; PIS: Participant Information Sheet; SPSS:
Statistical Package for the Social Sciences
Introduction
Individuals rely on visual search skills to identify a
target among distractors on perceptual dimensions [3]. It is a process
of object recognition, and it happens on everyday life such as searching
for the desired product in the supermarket, identifying names on a
list, or even looking for a food item on a restaurant menu. Many
professionals such as medical doctors, airport security demand a high
level of vigilance in object recognition among other distractors. The
failure of vigilance can cause greatly lost of life and property.
Attention is a much-required effort in performing a visual searching
task [4,5]. Indeed, attention is a selective process, and it is
necessary for cultivating the focus on information that is most relevant
and limit the capacity on irrelevant ones [6,7]. Over the years, visual
search and the role of attention has been a great interest in
literature as an essential perceptual learning task of human cognition
[8]. The first paper on visual search was published in 1976, but the
rate of publication increased significantly only since 2005 [6]. Anne
Treisman’s Feature Integration Theory (FIT) had the greatest influence
and laid fundamental framework in elevating visual search study [1]. The
core of her theory was to distinct feature on a two-dimensional array
from distractors of which could be activated in a parallel search.
The FIT model suggested that the visual search
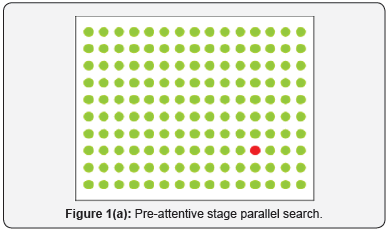
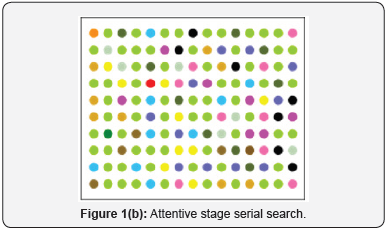
process deploys in two stages: pre-attentive and attentive. In the
pre-attentive stage, performing a parallel search can identify a
singleton simultaneously [6]. The search can be done almost effortlessly
by “pop out” virtue of a sole locus of activity [8,9]. Attentive stage
requires more complex effort in serial searching as the target is
specifically in conjunction with multiple features and share basic
features with the distractors. Eye movements are necessary to perform a
sequential serial search [6]. An operational example in pre-attentive
(parallel) and attentive (serial) search of a red circle among other
distractors was retrieved from Psy Toolkit website and shown in Figure 1
a&b [10,11]. Similar to many classic psychological theories,
Treisman’s FIT model has provoked much debate and has rarely been used
in visual search study by subsequent researchers. For example, Duncan
and Humphreys [3] proposed a new theory of search and visual attention
in their research.

Their study results did not support either a
distinction between serial and parallel search or between the search for
features and conjunctions. Alternatively, they proposed that a
continuum of search efficiency. It means that an increased similarity
between the target and non-target will increase the
difficulty in performing a visual search task and vice versa.
Visual search has been traditionally conducted in research
laboratories, where the participants were asked to locate
and identify a target among distracting items [9]. In a review
paper, the primary interest in visual search study included: the
modulation of visual attention in perceptual sensitivity, the
role of attention, the underlying neuronal responses, and the
eye movement during the selection process [6]. The existing
research methodology included: psychophysical research,
neurophysiological research, neuroimaging study, eyetracking
study.

Nevertheless, for the current experiment, the classic visual
search paradigm developed along the line with the FIT was
used [1]. The present experiment adopted the simplest visual
search paradigm. According to Stoet [2], the simplest visual
search paradigm consisted of some objects, and participants
needed to press a button if a target object is presented among
distractor objects and to withhold a response if a target object
is not presented. Results are analysed with the response time
(RT) and the “search slope”. RT indicates the time taken to
analyse the search. RT is typically longer to search for a target
object when more items are presented (display size). The
increase in search time is typically presented in a regression
line as the “search slope”. The steepness of the search slope
indicates the effectiveness of the search strategy, and a high
level of efficiency is indicated with shallower slopes [1].
In line with theories and existing literature, two research
question of the present experiment were proposed as 1) Does
the similarity between the target and non-targets affect search
times (RT)? 1) Does the number of non-targets affect search
times (RT)?
Gender differences
There has been a continuous growth of literature in
exploring gender differences in human cognition and cognitive
abilities [12]. Many researchers supported robust male
advantage marked in spatial awareness, mental rotations and
mathematical skills [13,14]. On the other hand, females are in
favour with verbal abilities, and phonological verbal fluency
[13,14]. However, with the availability substantial amount
of studies on visual search, studies on gender difference in
performing visual search task has been limited [2]. Stoet [2]
was the first research in exploring gender difference in this
perspective. He found that men were faster and more accurate
in a classic visual search task. However, contradictory results
were found by Solianik and colleagues [15]. Employed a
cognitive test battery included a visual search task to assess
attention, they found no significant gender differences in the
mean values in performing the task. Nevertheless, they found
that higher variability of memory and attention in women
indicated that their performance was lower on these cognitive
abilities. In line with existing literature, another research
question of the present experiment was proposed as: Do men
and women perform differently in visual searching?
Method
Design
The present assignment sought to explore the response
time (RT) in performing a visual search task in corresponding
to the similarity of the objects and the number of distractors,
and gender difference in the performance of computer version
of the visual search task. The RT was measured in milliseconds
(ms). In comparing gender difference, the between-subjects
variable of interest is gender. Gender (two levels: female and
male) was the independent variables. The dependent variable
was the response time (RT).
Participants
Participants of the present experiment were recruited by
convenience sampling. Convenience sampling is a type of nonprobability
sampling in which participants are sampled merely
because “they are convenient sources of data for researchers”.
Present experiment included 3 participants (1 male, 2 female).
Apparatus

It was a web-based learning experiment, and non-nameable
stimuli were presented on a computer monitor. Participants
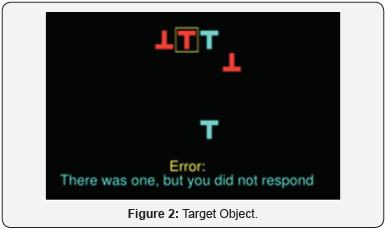
were required to identify the target letter T in orange color and
regular upright position. Participant needed to press the space
bar button if the target object appeared, and to withhold if the
target object was not presented (Figure 2). An error message would appear either when the participant did not press the
space button if the target object appeared or press the space
button when the target object was not presented (Figure
3). There were altogether 50 search displays in the present
experiment and the expected completion time of the task was
5 minutes.

There were a combination of 5, 10, 15, or 20 items in each
display array. The materials of the current experiment were
readily available on the PsyToolkit website, a free online
psychological experiments website for and students to use
educational or research purposes without further permission
[10,11].
Procedure
Research of the present experiment followed the code
of human research ethics as published by the British
Psychological Society (BPS) in the procedures for valid consent,
confidentiality, anonymity, and fair treatment.
Along the line of research ethics, the Participant
Information Sheet (PIS) and consent form were presented
to the participants before participating in the present
experiment. The PIS provided necessary information to the
participants in understanding the purpose, methods, risks
and benefits of the present experiment. The planned use
of the data to be collected was also informed, and thus the
participants can decide whether to participate in the present
experiment. After understanding the PIS, the participant was
invited to sign the consent form. The signed consent form with
identifying information was stored separately from the data
collected. Therefore, there was no identifying information of
the participants’ identity in corresponding to the collected
data. Demographic data included age and gender of the
participants were collected. Participants were then instructed
to visit Psytoolkit website to participate in the experiment and
followed the subsequent instructions [10,11].
Result
The data collected from the present experiment are not
required to perform any statistical analysis. To analyse the
data collected, the following statistical analysis procedures
will be followed.
The raw data collected were presented in an output data
file in five columns:
I. Blockname,
II. distractor present? (1=yes, 0=no),
III. number of distractors,
IV. status (1=correct, 2=error, 3=too slow), and
V. the response time (RT) (ms).
After running an individual experiment from each
participant, the output data was available on the screen for
copy and paste onto an excel table. After that, the consolidated
output datafile will be converted into statistical software. The
statistical software of the Statistical Package for the Social
Sciences (SPSS) will be used to perform statistical analysis,
and the results are being presented as follow. Results with p <
0.05 were considered statistically significant.
To have an overview of the data collected, the descriptive
statistics of the participants and the performance on each
attempt will be presented. The descriptive statistics will
include the means, standard deviations, and test statistics
for each attempt. To address the first two research questions,
search times (RT) will be analysed by performing a visual
search task in corresponding to the similarity of the objects
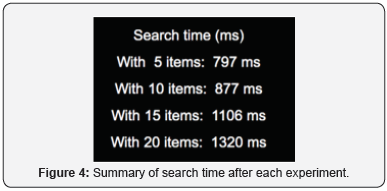
and the number of distractors. A quick summary of the search
times was available after the completion of each experiment
(Figure 4). To analysis, if there is a significant difference in RT
in correspond with the number of items in the display array,
an independent samples t-test can be used. The t-test is used
to assess whether there is a statistically significant difference
between the means of the two conditions

To address the third research question on gender
difference in performing a visual search task, analyses for the
experimental task can be done by a mixed analysis of variance
(ANOVA). ANOVA is the parametric equivalent of the t-test
and is used when more than two groups are presented [16]. In
the present experiment, the between-subject factor “gender”
(female vs male). In performing repeated-measures analyses,
Mauchly’s test of sphericity will be used. A repeated measures
ANOVA with a Greenhouse-Geisser correction will be used to
determine if there is a significant difference between males
and females in performing the task.
Apart from the response time (RT), a search slope will be
used to analyse the search speed and accuracy. The search
slope indicates how much slower a participant gets with each
additional item in the search displays [2]. The search slope will be calculated in a liner regression with the set size as the
independent variable.
Framework
The present experiment sought to fill the research gap in
exploring gender difference in the visual searching task to the
existing literature [2]. ANOVA is seemed to be an appropriate
methodology in examining the statistical difference between
males and females in performing a visual search task. However,
the raw output data elicited difficulty in performing such
statistical analysis. To look at the between-group significance,
a composite index is required to summarise the overall
performance in accordance to the response status (correct,
error, too slow), and the response time (RT). The appropriate
formula in calculating a composite index ought to be further
explored. Similar to many existing visual search study, one
limitation of the present experiment design is the focus of the
research. Indeed, many of the existing visual search studies
focus on distractor suppression, but the secondary inhibition
mechanism has not been much emphasized [7]. Nevertheless,
the inhibitory mechanism is ubiquitous and should play a
key role in visual information processing [17,18]. Another
limitation of the current project can be the sample size.
The limited sample size may reduce the power of the
present project and increase the margin of error. Also, a small
sample size tends to increase the Type II error in skewing
the results. Sample size calculation in the early stages of any
research study is an ethical and scientific consideration [19].
However, there has been limited guidance on how the sample
size of a pilot study should be, and the views of the researchers
seem varied. According to Hertzog [20], it is a general guideline
to use 10% of the sample size of a full study. Viechtbauer and
colleagues [21] suggested that if a 95% confidence is identified
in a full study, then 5% of the sample size of a full study should
be included. Nevertheless, the rule of thumb to calculate the
sample size is essential to conduct any kind of research [22-23].
As a personal reflection of experience in designing the
present experiment from scratch, there have been hurdles. It
seems reasonable to adopt a top-down process of designing an
experiment by identifying a research question with an extensive
literature review [24]. However, it sounds more practical to
look at the research methodology and more importantly, the
experimental materials for guidance to narrow down the
focus on the literature review [25]. Indeed, there is a vast
amount of existing literature available on visual search. The
review process can easily get lost track. All in all, it has been
a valuable experience to be in part of the present experiment,
and it provides direction in kicking off the dissertation project
shortly.
To Know More About Trends in Technical and Scientific
Research click on: https://juniperpublishers.com/ttsr/index.php


Comments
Post a Comment